2025 Canadian Used Car Market Annual Report
2025 Canadian Used Car Market Annual Report: A Year of Normalization
The Canadian used car market in 2025 processed over 1 million listings across nearly 800,000 unique vehicles, marking a return to pre-pandemic normalcy after years of supply chain disruption and price volatility. This comprehensive annual analysis reveals the full picture of Canada's automotive marketplace: pricing evolution, regional dynamics, powertrain transitions, and the models that defined the year.
After the pandemic-era price spikes of 2021-2023 and the correction of 2024, 2025 represented market stabilization. Prices found equilibrium, inventory recovered, and buyer-seller dynamics returned to traditional patterns—though with permanently altered baselines.
Executive Summary: 2025 By The Numbers
Total Listings
1,046,658
Unique Vehicles
787,815
Annual Avg Price
$46,763
Median Price
$40,163
Key 2025 Market Metrics:
| Metric | 2025 Value | Context |
|---|---|---|
| Total Listings Analyzed | 1,046,658 | Full-year market coverage |
| Unique Vehicles | 787,815 | Individual VINs processed |
| National Average Price | $46,763 | Annual weighted average |
| National Median Price | $40,163 | 50th percentile benchmark |
| Average Odometer | 43,385 km | Market-wide average mileage |
| Price Range | $1,006 - $499,999 | Full market spectrum |
The year told a story of two halves: stable but elevated pricing through Q3, followed by Q4 correction and December's surprising recovery. Monthly averages ranged from $42,553 (November low) to $50,369 (August high), reflecting seasonal patterns layered onto structural market normalization.
Monthly Price Trajectory
Average and median prices throughout the year
YTD Change
-3.2%
Quarterly Analysis
Q1 2025 (Feb-Mar): Market opened strong with $48,881-$49,100 averages. Limited winter inventory and post-holiday demand supported elevated pricing. March's 141,455 listings marked the year's spring inventory surge.
Q2 2025 (Apr-Jun): Pricing moderated to $46,906-$48,690 range as inventory expanded. Traditional spring buying season brought equilibrium between supply and demand. Lower volume months (May: 20,089, June: 19,303 listings) reflected data collection patterns rather than market contraction.
Q3 2025 (Jul-Sep): August spike to $50,369 average represented the year's pricing peak—a combination of summer demand, limited dealer inventory, and pre-2026 model year positioning. September's 166,914 listings initiated the fall inventory surge.
Q4 2025 (Oct-Dec): The year's most dynamic quarter. October and November saw aggressive correction (down to $42,553), followed by December's surprising 11.2% recovery to $47,317. This pattern reflected dealer inventory management: clear aged stock in October-November, introduce fresh inventory in December.
Body Style Market Share
Full-year market composition by vehicle type
Body Style Analysis
SUV Dominance Continues: SUVs claimed 52.9% of all 2025 listings—over 550,000 vehicles—averaging $44,447. This represents slight expansion from previous years as Canadian consumers continue prioritizing utility and all-wheel-drive capability. The segment ranges from entry-level subcompacts (Nissan Kicks at $29,616) to premium three-row SUVs (Ford Explorer at $50,656).
Pickup Truck Premium: At 14.4% market share with $67,146 average pricing, pickups command significant premiums. The segment bifurcates between work trucks and luxury variants—base F-150s under $50,000 coexist with $90,000+ GMC Denali and RAM Laramie trims. Full-size trucks (F-150, Sierra, Silverado, RAM 1500) dominated inventory.
Sedan Value Proposition: Representing 10.8% of market at $31,319 average, sedans remain the undervalued segment. As consumer preference shifted to SUVs, sedan pricing compressed, creating opportunity for value-focused buyers. Hyundai Elantra ($22,920), Honda Civic ($24,919), and Toyota Camry offer reliable transportation at significant discounts to comparable SUVs.
Emerging Segments: Hatchbacks (4.1% share, $27,656 avg) provide SUV-alternative utility at lower price points. Wagons (0.9% share, $30,447 avg) remain niche but offer compelling value for those prioritizing cargo capacity without SUV bulk.
Powertrain Distribution
Fuel type distribution across all listings
Total
1,046,658
Hybrid/EV
10.9%
Avg Gas Price
$43k
Powertrain Trends
Gasoline Remains Dominant: At 60.7% market share with $43,238 average pricing, internal combustion engines remain the mainstream choice. This reflects both consumer preference and the used car market's inherent lag—most 2025 used inventory represents 2020-2024 production when gas vehicles dominated new sales.
Hybrid Growth: Hybrids captured 7.8% market share at $54,329 average—a 26% premium over gasoline equivalents. This premium reflects both newer model years and strong demand for fuel efficiency without range anxiety. Top hybrids included Honda CR-V Hybrid (8,162 listings at $50,016), Hyundai Tucson Hybrid, and Ford Escape Hybrid.
Electric Vehicle Presence: EVs represented 3.1% of 2025 inventory at $60,326 average. While still niche, EV listings grew throughout the year as fleet returns, lease maturities, and trade-ins increased supply. Tesla Model 3 led with 1,143 listings, followed by Ford Mustang Mach-E (3,774) and Chevrolet Equinox EV (3,801).
Diesel Premium: Commercial and truck-focused diesel vehicles averaged $88,388—highest of any fuel type—representing 3.4% of market. This reflects heavy-duty pickup trucks and commercial vehicles rather than passenger cars.
Top Manufacturers
Market leaders by total listings volume
Manufacturer Analysis
Ford Leadership: With 138,740 listings (13.3% market share), Ford dominated 2025 inventory—driven by F-150 popularity (40,164 listings), Escape SUV (21,413), and Bronco Sport (12,775). Average pricing of $53,690 reflects truck-heavy portfolio.
GM Portfolio Strength: Combined Chevrolet (87,787 listings) and GMC (56,774 listings) represent 13.8% of market. GMC's $70,239 average versus Chevrolet's $52,345 illustrates brand positioning—same platforms, different trim emphasis.
Asian Manufacturers Value Position: Honda ($35,939 avg), Nissan ($31,151), Hyundai ($32,052), Toyota ($41,338), and Kia ($33,409) collectively represented 32.0% of market with significantly lower average pricing than American brands. This reflects sedan/compact SUV focus versus truck-heavy domestic portfolios.
Toyota Retention: Despite lower volume (63,424 listings), Toyota's $41,338 average reflects strong residual values—vehicles hold value longer, creating less turnover but higher pricing when available. See our Best Toyota RAV4 Years and Best Toyota Camry Years guides.
Top 25 Models of 2025
| Rank | Make | Model | Listings | Avg Price | Avg Odometer |
|---|---|---|---|---|---|
| 1 | Ford | F-150 | 40,164 | $65,594 | 41,166 km |
| 2 | Nissan | Rogue | 23,654 | $33,442 | 38,770 km |
| 3 | GMC | Sierra 1500 | 22,339 | $72,441 | 34,120 km |
| 4 | Ford | Escape | 21,413 | $32,526 | 43,863 km |
| 5 | Chevrolet | Silverado 1500 | 18,691 | $64,076 | 40,334 km |
| 6 | Honda | CR-V | 18,575 | $33,804 | 62,148 km |
| 7 | Mazda | CX-5 | 16,120 | $36,784 | 36,977 km |
| 8 | Nissan | Kicks | 14,271 | $29,616 | 20,115 km |
| 9 | Toyota | RAV4 | 12,931 | $33,947 | 62,350 km |
| 10 | Ford | Bronco Sport | 12,775 | $40,546 | 15,989 km |
| 11 | Hyundai | Tucson | 12,678 | $30,538 | 48,578 km |
| 12 | Hyundai | Elantra | 12,610 | $22,920 | 48,135 km |
| 13 | Volkswagen | Tiguan | 12,242 | $34,174 | 49,207 km |
| 14 | Chevrolet | Trax | 10,902 | $29,399 | 13,706 km |
| 15 | RAM | 1500 | 10,437 | $68,211 | 32,298 km |
| 16 | Volkswagen | Taos | 10,155 | $36,478 | 15,603 km |
| 17 | Hyundai | Kona | 9,903 | $29,248 | 35,124 km |
| 18 | Honda | CR-V Hybrid | 9,825 | $50,258 | 6,385 km |
| 19 | Jeep | Compass | 9,743 | $37,387 | 23,080 km |
| 20 | Subaru | Crosstrek | 9,639 | $32,958 | 27,164 km |
| 21 | Chevrolet | Equinox | 9,573 | $32,912 | 47,158 km |
| 22 | GMC | Terrain | 9,264 | $36,977 | 38,809 km |
| 23 | Honda | Civic | 9,237 | $24,919 | 70,306 km |
| 24 | Jeep | Wrangler | 9,215 | $55,402 | 29,344 km |
| 25 | Kia | Seltos | 8,654 | $30,614 | 26,702 km |
Model Highlights
Full-Size Trucks Lead Volume: Ford F-150 (40,164 listings), GMC Sierra (22,339), Chevrolet Silverado (18,691), and RAM 1500 (10,437) collectively represent 91,631 listings—8.8% of all 2025 inventory. Average pricing ranges from $64,076 (Silverado) to $72,441 (Sierra), reflecting trim-level distribution.
Compact SUV Dominance: The $30,000-$37,000 segment offers exceptional variety—Nissan Rogue, Ford Escape, Honda CR-V, Mazda CX-5, Toyota RAV4, Hyundai Tucson, VW Tiguan, Subaru Crosstrek, Chevrolet Equinox. This segment provides optimal balance of utility, efficiency, and value for Canadian families.
Entry-Level Opportunities: Nissan Kicks ($29,616 avg with low 20,115 km odometer), Chevrolet Trax ($29,399, 13,706 km), and Hyundai Elantra ($22,920) offer accessible entry points with relatively fresh inventory.
Hybrid Success Story: Honda CR-V Hybrid's 9,825 listings with $50,258 average and remarkably low 6,385 km average odometer demonstrates hybrid demand. These are near-new vehicles commanding near-new prices—buyers are willing to pay premium for electrified powertrains.
Model Year Distribution
Listings distribution across vehicle model years
Model Year Analysis
2025-2026 Model Years Dominate: Combined 506,828 listings (48.4% of market) represent new and near-new inventory—dealer stock, fleet returns, and lease-end vehicles. These command premium pricing ($58,078-$62,736 averages) with minimal mileage.
2022-2024 Sweet Spot: For used car buyers seeking balance between price and condition, 2022-2024 model years (257,663 listings) offer $38,274-$51,677 pricing with 24,901-65,936 km average mileage. This segment provides modern safety features and technology at significant depreciation savings.
Value Segment (2017-2021): Vehicles 4-8 years old (213,092 listings) average $21,766-$33,475 with higher mileage (79,070-134,741 km). This segment serves budget-conscious buyers willing to accept higher maintenance likelihood for lower purchase price.
Depreciation Curve: The data reveals typical depreciation pattern—approximately $5,000-$7,000 per year for first 3 years, slowing to $2,500-$4,000 per year thereafter. A 2023 model averaging $42,697 versus 2022 at $38,274 shows 10.4% annual depreciation in early years.
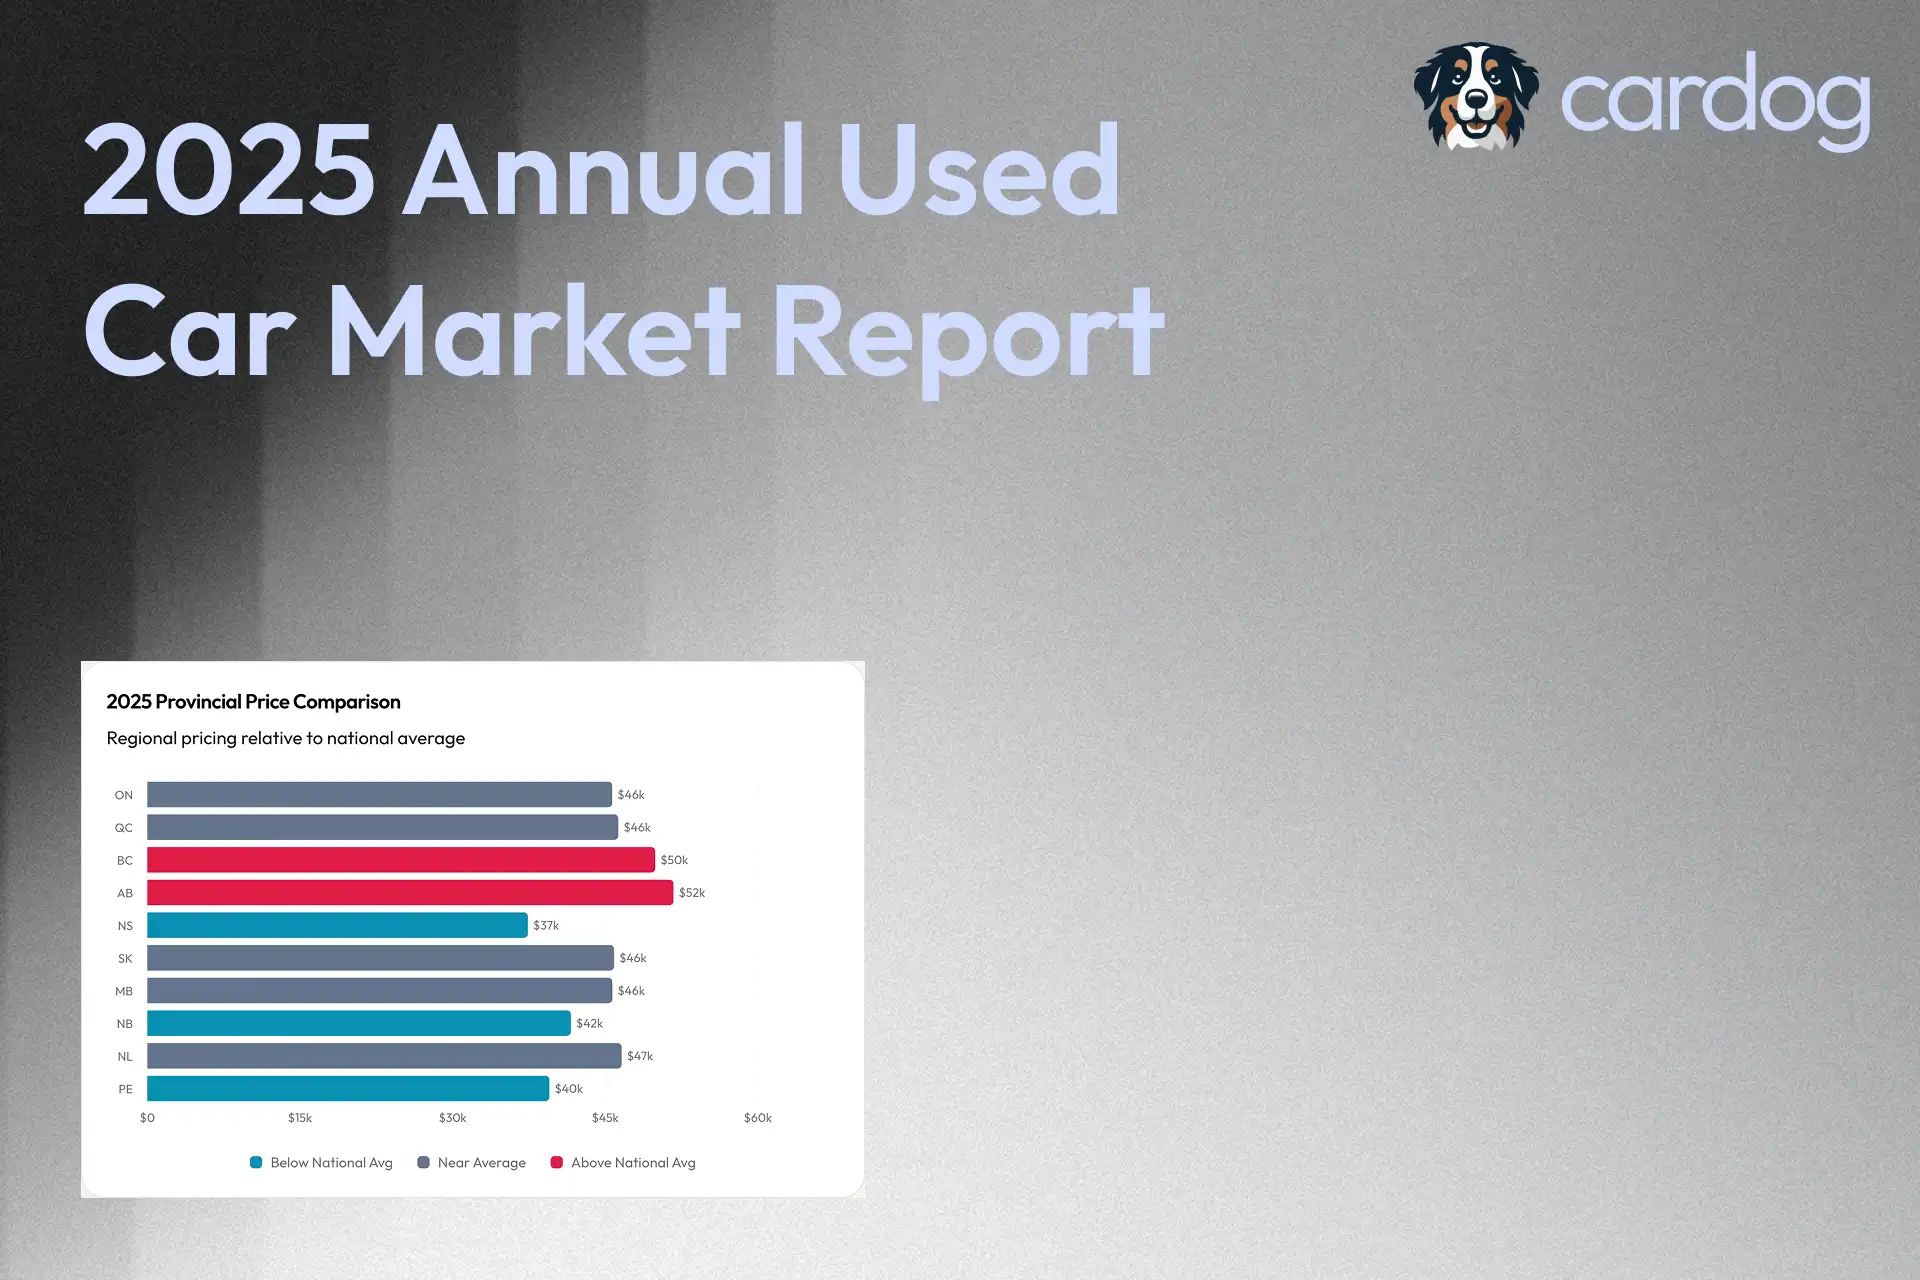
Provincial Market Analysis
Regional pricing relative to national average
Regional Insights
Ontario Dominates: With 456,752 listings (43.6% of market), Ontario is Canada's used car hub. Pricing at $45,695 sits 2.3% below national average despite highest population density, reflecting competitive dealer landscape and inventory abundance. Explore listings in Toronto, Ottawa, or Hamilton.
Western Premium: Alberta ($51,714, +10.6%) and British Columbia ($49,917, +6.7%) command premiums reflecting truck-heavy markets (Alberta) and import-focused, lower-mileage inventory (BC). Western buyers pay more but often access better-condition vehicles.
Quebec Value: At $46,292 average with 175,394 listings, Quebec offers near-national-average pricing with substantial inventory. French-language market dynamics create opportunities for bilingual buyers.
Atlantic Affordability: Nova Scotia ($37,403, -20.0%), New Brunswick ($41,629, -11.0%), and PEI ($39,514, -15.5%) offer significant savings versus national average. Trade-off: higher average mileage (NS: 58,747 km vs national 43,385 km) and limited selection.
Newfoundland Anomaly: Despite isolation, Newfoundland averages $46,616 with remarkably low 24,178 km average odometer—suggesting premium pricing for low-mileage vehicles shipped to the province.
Electric Vehicle Market Deep Dive
Electric vehicle market leaders
EV Market Analysis
GM's EV Push Shows Results: Chevrolet Equinox EV (3,801 listings at $55,479) and Blazer EV (1,018 listings at $62,299) demonstrate General Motors' aggressive EV inventory building. These near-new vehicles represent dealer stock and early fleet returns.
Ford EV Strength: Mustang Mach-E (3,774 listings, $54,209) and F-150 Lightning (2,318 listings, $78,544) showcase Ford's electric portfolio. The Lightning's premium pricing reflects limited supply and electric truck novelty.
Tesla Value Opportunity: Model 3 at $29,393 average offers compelling entry to EV ownership—though 86,491 km average odometer indicates these are higher-mileage vehicles experiencing typical EV depreciation. Model Y at $43,805 with 72,008 km offers similar value proposition in crossover form.
EV Depreciation Reality: The gap between near-new GM EVs ($55,000-$62,000) and higher-mileage Teslas ($29,000-$44,000) illustrates EV depreciation curves. Early adopters faced steep depreciation; current buyers benefit from normalized pricing.
Price Distribution Analysis
Full-year inventory by price segment
Affordability Analysis
Budget Segment (Under $25k): 203,584 listings (19.4% of market) offer accessible transportation. This segment grew throughout 2025 as depreciation normalized pricing and dealers prioritized turnover on aged inventory.
Mass Market ($25k-$50k): 479,673 listings (45.8% of market) represent the largest combined segment—where most Canadian families shop. Compact SUVs, mid-size sedans, and base-trim trucks populate this range.
Premium/Luxury ($50k+): 363,401 listings (34.7% of market) reflects Canada's appetite for trucks, premium SUVs, and luxury vehicles. This segment's size indicates dealers maintain substantial high-margin inventory.
Affordability Trend: Throughout 2025, the sub-$35,000 segment expanded from 38% (early year) to 51% (November peak) before moderating to 40% by December—evidence of market normalization rather than crisis-level affordability concerns.
Top Hybrid Vehicles
| Rank | Make | Model | Listings | Avg Price | Avg Odometer |
|---|---|---|---|---|---|
| 1 | Honda | CR-V Hybrid | 8,162 | $50,016 | 6,874 km |
| 2 | Hyundai | Tucson Hybrid | 3,706 | $48,285 | 3,360 km |
| 3 | Ford | Escape Hybrid | 3,668 | $39,501 | 22,959 km |
| 4 | Ford | F-150 Hybrid | 3,212 | $79,821 | 35,593 km |
| 5 | Mitsubishi | Outlander PHEV | 2,250 | $48,574 | 21,967 km |
| 6 | Ford | Maverick Hybrid | 2,069 | $44,846 | 5,595 km |
| 7 | Volvo | XC60 Hybrid | 2,065 | $62,068 | 17,225 km |
| 8 | Volvo | XC40 Hybrid | 1,633 | $56,159 | 5,005 km |
| 9 | Toyota | Sienna Hybrid | 1,536 | $57,331 | 32,292 km |
| 10 | Honda | Civic Hybrid | 1,428 | $38,476 | 2,792 km |
Hybrid Analysis: Low average odometers across top hybrids (2,792-35,593 km) indicate these are predominantly recent-model-year vehicles—2023-2025 production. The hybrid segment represents a transitional market: buyers seeking electrification without full EV commitment, resulting in strong demand and stable pricing.
2026 Market Outlook
Expected Trends
Inventory Expansion: As 2026 production ramps and 2023-2024 leases mature, expect 15-20% inventory growth in used market. This supply increase should moderate pricing, particularly in the 2-3 year old segment.
EV Normalization: Electric vehicle depreciation will continue stabilizing as charging infrastructure expands and battery technology improves. Watch for Tesla price floors and GM EV inventory maturation.
Hybrid Premium Compression: As more hybrids enter the used market, the current 26% premium over gasoline equivalents should compress to 15-20%. This creates opportunity for early hybrid adopters selling and new buyers entering.
Regional Convergence: Digital marketplace expansion continues eroding provincial price differentials. Expect Alberta/BC premiums to compress as cross-provincial transactions become routine.
Strategic Recommendations
For 2026 Buyers:
- Best timing: Early Q1 (January-February) typically offers stable pricing before tax-season demand
- Model year sweet spot: 2022-2023 vehicles offer optimal balance of modern features, reasonable mileage, and meaningful depreciation savings
- EV consideration: If charging infrastructure suits your needs, Tesla Model 3 at $29,000 average represents compelling value
- Provincial arbitrage: Quebec and Atlantic Canada offer 10-20% savings versus Western provinces
For 2026 Sellers:
- Trade-in timing: Q2-Q3 typically offers strongest residual values before fall inventory surge
- Hybrid advantage: Hybrid vehicles maintain premium pricing—don't discount aggressively
- Low-mileage premium: Fresh inventory success in December 2025 confirms buyers pay for lower odometer readings
How Cardog Tracks This Data
This report analyzed over 1 million listings using Cardog's automotive intelligence platform. We continuously monitor the Canadian used car market, tracking pricing, inventory composition, and regional dynamics in real-time.
For any specific vehicle, Cardog provides market context: where a listing sits relative to comparable vehicles, whether pricing represents fair value, and how the model trends over time. Whether you're evaluating a Ford F-150, Toyota RAV4, or Tesla Model 3, Cardog surfaces the intelligence needed for informed decisions.
Explore our monthly market reports for detailed analysis: October 2025, November 2025, December 2025.
Explore live market data or use our AI Assistant to research specific vehicles.