November 2025 Used Car Market Report: Price Decline Accelerates as Inventory Tightens
November 2025 Used Car Market Report: Price Decline Accelerates as Inventory Tightens
Canada's used car market entered a significant transition period in November 2025, with prices dropping 6.8% month-over-month to $42,903 while inventory contracted by 20%. This comprehensive analysis of 154,950 listings reveals a market increasingly dominated by aged inventory as dealers navigate the traditional year-end slowdown.
The dual forces of declining prices and tightening supply created unique opportunities for value-conscious buyers willing to accept higher-mileage vehicles, while sellers faced intensifying pressure to move inventory ahead of 2026 model year arrivals.
Executive Summary
Key Findings:
- National Average Price: $42,903 in November 2025 (down 6.8% from October's $46,018)
- Total November Listings: 154,950 new active listings (down 20.1% from October's 193,893)
- Average Odometer: 60,795 km (up 38.5% from October's 43,905 km)
- Price Range: $1,000 to $7.3 million
- Market Leaders: Ford F-150 (5,541 listings), Nissan Rogue (3,492), Ford Escape (2,962)
November marked an inflection point where the seasonal Q4 slowdown converged with dealer inventory management strategies, resulting in the steepest month-over-month price decline of 2025. The dramatic 38.5% increase in average odometer readings indicates dealers prioritized moving aged, high-mileage stock over maintaining fresh inventory levels.
National Market Overview
Pricing Trends
November delivered the most significant pricing correction of 2025:
| Metric | November 2025 | October 2025 | Change |
|---|---|---|---|
| Average Price | $42,903 | $46,018 | -6.8% |
| Average Odometer | 60,795 km | 43,905 km | +38.5% |
| Total Listings | 154,950 | 193,893 | -20.1% |
| Median Price (est.) | ~$35,000 | ~$38,000 | -7.9% |
Analysis: The 6.8% month-over-month price decline represents the most aggressive correction since the pandemic-era bubble began deflating. Combined with a 20% inventory contraction, the data reveals dealers strategically reducing listing volumes while clearing aged stock. The 38.5% surge in average odometer readings (from 43,905 km to 60,795 km) signals a fundamental shift in inventory composition—dealers are holding premium low-mileage units while aggressively pricing older inventory to maintain cash flow through year-end.
Sequential Pricing Context
| Month | Average Price | MoM Change |
|---|---|---|
| September 2025 | $47,583 | - |
| October 2025 | $46,018 | -3.3% |
| November 2025 | $42,903 | -6.8% |
| Q4 Cumulative | - | -9.8% |
The accelerating decline trajectory (-3.3% in October, -6.8% in November) suggests December could see additional softening as dealers execute final year-end clearance strategies. For detailed October market analysis, see our October 2025 Used Car Market Report.
Market Composition
By Body Style
| Body Style | Listings | Avg Price | Market Share |
|---|---|---|---|
| SUV | 84,004 | $41,818 | 54.2% |
| Pickup Truck | 26,689 | $63,010 | 17.2% |
| Sedan | 19,618 | $26,521 | 12.7% |
| Other | 7,430 | $42,352 | 4.8% |
| Hatchback | 7,194 | $24,118 | 4.6% |
| Minivan | 3,321 | $34,856 | 2.1% |
| Coupe | 1,951 | $60,408 | 1.3% |
| Wagon | 1,914 | $29,504 | 1.2% |
| Van | 1,842 | $50,145 | 1.2% |
| Convertible | 810 | $67,465 | 0.5% |
| Truck | 104 | $62,926 | 0.1% |
| Motorcycle | 73 | $16,281 | 0.0% |
Month-over-Month Changes:
- SUV share stable at 54.2% (vs 55.1% in October), averaging $41,818 (down 4.1%)
- Pickup trucks down to $63,010 from $67,459 (6.6% decline) as new 2026 models arrive
- Sedans fell to $26,521 from $30,323 (12.5% decline)—steepest correction of any segment
- Hatchbacks dropped to $24,118 from $26,644 (9.5% decline), offering exceptional entry-level value
The sedan segment's 12.5% monthly decline suggests dealers aggressively clearing passenger car inventory as SUV preference intensifies.
By Fuel Type
| Fuel Type | Listings | Avg Price | Market Share |
|---|---|---|---|
| Gasoline | 119,714 | $39,517 | 77.3% |
| Hybrid | 15,780 | $53,550 | 10.2% |
| Diesel | 6,452 | $83,750 | 4.2% |
| Electric | 3,993 | $52,180 | 2.6% |
| Unknown | 9,011 | $35,882 | 5.8% |
Fuel Type Trends:
- Gasoline market share up to 77.3% from 76.6%, averaging $39,517 (down 6.8% MoM)
- Hybrid premium compressed to $53,550 from $55,150 (2.9% decline), narrowing gap vs gasoline
- Diesel down sharply to $83,750 from $90,042 (7.0% decline) as commercial buyers delay purchases
- Electric averaged $52,180 vs $57,374 in October (9.1% decline)—accelerating depreciation continues
Electric vehicles experienced the steepest fuel-type decline at 9.1%, reflecting ongoing market recalibration as 2026 EV models with improved range and charging capabilities approach market.
Provincial Market Breakdown
Regional Pricing Analysis
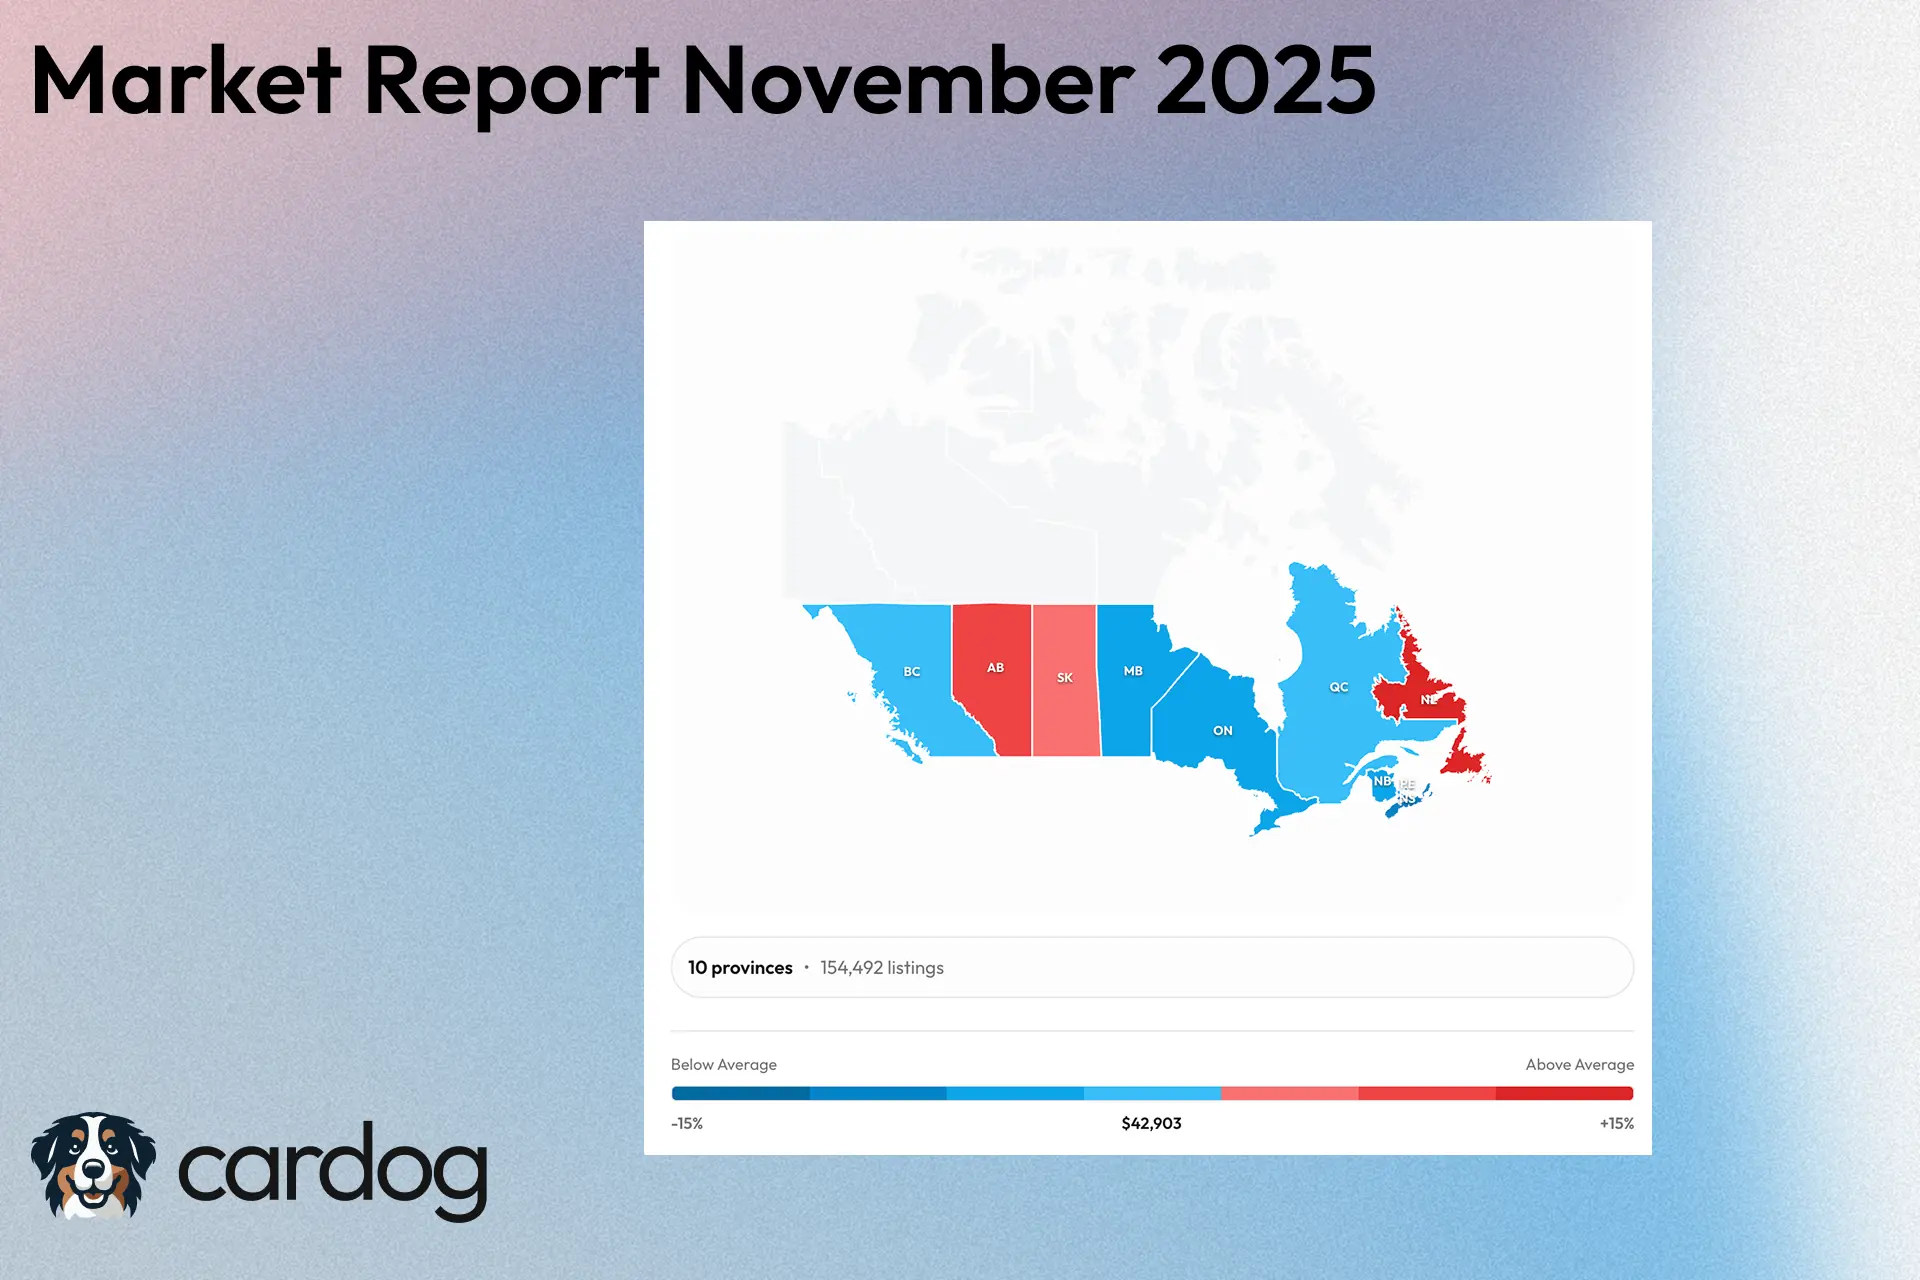
| Province | Listings | Avg Price | Avg Odometer | Market Share |
|---|---|---|---|---|
| Ontario | 73,944 | $41,439 | 57,041 km | 47.7% |
| Alberta | 20,717 | $46,951 | 59,716 km | 13.4% |
| Quebec | 20,678 | $43,850 | 41,347 km | 13.3% |
| British Columbia | 20,509 | $43,840 | 103,751 km | 13.2% |
| Nova Scotia | 5,302 | $37,648 | 64,249 km | 3.4% |
| Saskatchewan | 3,821 | $45,013 | 60,458 km | 2.5% |
| Newfoundland | 3,240 | $49,476 | 22,658 km | 2.1% |
| Manitoba | 3,182 | $41,506 | 50,697 km | 2.1% |
| New Brunswick | 2,747 | $39,893 | 49,594 km | 1.8% |
| PEI | 352 | $36,529 | 34,574 km | 0.2% |
Average pricing by province compared to national average
Regional Insights
Ontario expanded market share to 47.7% (from 43.0% in October) with 73,944 listings, though average prices fell 8.0% to $41,439. The province's dominance increased as other regions contracted inventory more aggressively. Browse inventory in Toronto, Ottawa, or Mississauga.
Alberta prices declined 7.4% to $46,951 despite maintaining highest provincial average. The 26% inventory contraction (from 28,028 to 20,717 listings) suggests dealers strategically limited supply to support pricing.
British Columbia showed dramatic odometer surge to 103,751 km (up from 43,957 km in October)—a 136% increase indicating dealers moving significantly aged inventory. Prices dropped 6.8% to $43,840.
Quebec maintained relatively low mileage at 41,347 km (up only 11% MoM) while prices fell 7.4% to $43,850, suggesting better inventory quality than most provinces.
Nova Scotia remained value leader at $37,648 (up 0.8% from October's $37,351), making it only major province with month-over-month price increases—likely reflecting seasonal tourism market dynamics.
Newfoundland commanded highest pricing at $49,476 with remarkably low 22,658 km average odometer, indicating geographic isolation supports premium pricing for low-mileage units.
Top 20 Models by Inventory Volume
| Rank | Make | Model | Listings | Avg Price |
|---|---|---|---|---|
| 1 | Ford | F-150 | 5,541 | $58,963 |
| 2 | Nissan | Rogue | 3,492 | $30,444 |
| 3 | Ford | Escape | 2,962 | $30,054 |
| 4 | GMC | Sierra 1500 | 2,922 | $69,583 |
| 5 | Chevrolet | Silverado 1500 | 2,764 | $61,288 |
| 6 | Toyota | RAV4 | 2,677 | $33,706 |
| 7 | Honda | CR-V | 2,550 | $30,052 |
| 8 | Volkswagen | Tiguan | 2,350 | $34,437 |
| 9 | Mazda | CX-5 | 2,281 | $32,584 |
| 10 | Hyundai | Tucson | 2,048 | $29,652 |
| 11 | Hyundai | Elantra | 1,997 | $21,472 |
| 12 | Nissan | Kicks | 1,832 | $27,049 |
| 13 | Ford | Explorer | 1,739 | $50,656 |
| 14 | Subaru | Crosstrek | 1,704 | $33,404 |
| 15 | Ford | Bronco Sport | 1,689 | $41,171 |
| 16 | Hyundai | Kona | 1,660 | $28,053 |
| 17 | Honda | Civic | 1,649 | $22,133 |
| 18 | GMC | Terrain | 1,645 | $36,160 |
| 19 | RAM | 1500 | 1,453 | $66,936 |
| 20 | Chevrolet | Equinox | 1,422 | $30,927 |
Model Analysis
Pickup Truck Correction: Full-size trucks (F-150, Sierra, Silverado, RAM 1500) averaged $64,192 in November, down 5.9% from October's $68,211. The 2026 model year transition pressured 2024-2025 inventory pricing, creating opportunity for buyers willing to accept prior-year trucks.
Ford F-150 Volume Decline: The perennial leader fell to 5,541 listings from 6,859 in October (19% drop) while pricing contracted 8.7% to $58,963. This suggests Ford dealers are strategically limiting aged inventory ahead of 2026 F-150 refresh announcements.
Toyota RAV4 Ascends: RAV4 climbed to #6 from #13 in October with 2,677 listings, demonstrating Toyota's recession-resistant brand strength. At $33,706 average, RAV4 commands slight premium over CR-V ($30,052) but maintains strong value proposition. See our Best Toyota RAV4 Years to Buy guide for model-year specific recommendations, or browse RAV4 listings in Toronto.
Hyundai Value Dominance: Elantra ($21,472), Tucson ($29,652), and Kona ($28,053) all rank in top 20, making Hyundai the most represented brand by model count. Combined 5,705 Hyundai listings signal strong dealer confidence in Korean brand value positioning.
Sedan Opportunity: Elantra and Civic both averaged under $22,500 in November—down 6.6% and 12.5% respectively from October—offering exceptional entry-level value for buyers prioritizing affordability over SUV utility. Explore Honda Civic listings across Canada or check available Civics in Vancouver.
Explorer Enters Top 20: Ford Explorer's appearance at #13 (replacing Honda CR-V Hybrid) with 1,739 listings at $50,656 average suggests three-row SUV demand remains resilient despite broader market softening.
Affordability Analysis
Price Distribution
| Price Range | Listings | Percentage | Segment |
|---|---|---|---|
| Under $15,000 | 17,394 | 11.2% | Budget/Entry |
| $15,000-$25,000 | 27,516 | 17.8% | Economy |
| $25,000-$35,000 | 34,782 | 22.4% | Mass Market |
| $35,000-$50,000 | 39,191 | 25.3% | Mid-Market |
| $50,000-$75,000 | 25,681 | 16.6% | Premium |
| $75,000-$100,000 | 7,433 | 4.8% | Luxury |
| $100,000+ | 2,953 | 1.9% | Ultra-Luxury |
Affordability Shifts:
- 51.4% of market now priced under $35,000 (up from 49% in October), improving accessibility
- Mass market segment ($25k-$35k) declined to 22.4% from 23%, indicating price compression pushing inventory into lower tiers
- Mid-market ($35k-$50k) declined to 25.3% from 27.2%, evidence of aggressive pricing into mass-market range
- Entry segment (<$15k) expanded to 11.2% from 9.6%, reflecting dealers prioritizing aged inventory turnover
The upward shift in sub-$35k market share (51.4% vs 49% in October) combined with lower absolute prices indicates genuine affordability improvement for budget-conscious buyers.
Best Value Segments
Under $25,000 Opportunities:
- Hyundai Elantra: Average $21,472 (down 6.6% MoM)
- Honda Civic: Average $22,133 (down 12.5% MoM) — View Civic inventory
- Hatchback segment: Average $24,118 (down 9.5% MoM)
- Nissan Kicks: Average $27,049 (down 3.6% MoM) — Browse Kicks listings
$25,000-$35,000 Sweet Spot:
- Hyundai Kona: Average $28,053 (down 4.7% MoM)
- Hyundai Tucson: Average $29,652 (down 5.5% MoM) — Find Tucson deals
- Honda CR-V: Average $30,052 (down 9.4% MoM) — Best CR-V Years Guide | Browse CR-V inventory
- Ford Escape: Average $30,054 (down 2.4% MoM) — Escape listings in Calgary
- Nissan Rogue: Average $30,444 (down 5.1% MoM) — View Rogue inventory
The compact SUV segment ($29k-$31k range) represents November's optimal value proposition, combining utility, fuel efficiency, and aggressive month-over-month pricing corrections.
Market Outlook
December 2025 Expectations
Year-End Clearance Intensifies: Historical patterns suggest December sees 3-5% additional price reductions as dealers execute final clearance. Following October's 3.3% and November's 6.8% declines, December could deliver cumulative Q4 correction approaching 12-15%.
Inventory Stabilization: November's 20% listing contraction likely bottoms in December as dealers balance clearance urgency with maintaining showroom selection. Expect modest inventory recovery (5-10%) as new trade-ins arrive.
Low-Mileage Premium Widens: The November divergence between aged inventory (60,795 km average) and premium units suggests dealers will increasingly two-tier pricing—deep discounts on high-mileage stock, firmer pricing on sub-30,000 km units entering 2026.
Regional Convergence: Provincial price gaps narrowed in November (Alberta premium compressed from 10% to 9.4% vs national average). December should see further convergence as digital marketplaces facilitate cross-provincial transactions.
2026 Market Predictions
Q1 2026 Rebound: January-March typically delivers 5-8% sequential price increases as tax refund demand and spring buying season arrive. However, 2026 may see muted recovery given elevated absolute inventory levels relative to pre-pandemic norms.
EV Inflection Point: Electric vehicle depreciation should stabilize in 2026 as battery technology maturation reduces range anxiety and charging infrastructure expands. November's 9.1% EV price decline likely represents peak depreciation pressure.
Truck Market Bifurcation: Full-size pickup premiums will compress for base models while high-trim luxury variants (Platinum, Denali, Laramie) maintain pricing power. The $60k-$70k mid-trim segment faces greatest pressure.
Hybrid Ascendancy: Hybrid market share expanding (10.2% in November vs 11.3% in October) positions electrified vehicles as mainstream choice by mid-2026. Expect hybrid premiums to stabilize at 20-25% vs gasoline equivalents.
Strategic Recommendations
For Buyers:
- Timing is critical: December 2025 likely offers peak buying power before Q1 2026 seasonal rebound
- Sedan opportunity: 12.5% November decline in sedan pricing creates rare value moment for non-SUV buyers
- Mileage trade-offs: Accepting 70,000-90,000 km vehicles (vs sub-50k km) can unlock 15-20% savings
- Geographic arbitrage: Nova Scotia ($37,648) and PEI ($36,529) offer 12-14% discounts vs Alberta/Newfoundland
- EV value timing: Wait for Q1 2026 stabilization unless immediate need; depreciation curve flattening ahead
For Sellers:
- Urgency paramount: Every week of delay risks additional 0.5-1% value erosion through December
- Price aggressively: Market clearing price is 5-8% below perceived value; dealers are capitulating on aged inventory
- Highlight low mileage: Sub-40,000 km odometers command disproportionate premiums in tightening market
- Regional optimization: List in Alberta/BC for 10-15% premium over Atlantic Canada, factor in buyer transportation costs
- Avoid January trap: Waiting for spring rebound risks 2026 model competition; clear inventory by year-end
How Cardog Provides Market Intelligence
Navigating November's complex dynamics—declining prices, tightening inventory, and shifting regional patterns—requires real-time market intelligence beyond static reports. Cardog's AI-powered platform continuously analyzes over 900,000 active listings to provide instant context on whether any specific vehicle reflects current market pricing or represents an outlier opportunity.
The platform's strength emerges in rapidly changing markets: when the Ford Escape dropped 2.4% month-over-month while the Honda Civic fell 12.5%, understanding model-specific trends becomes critical. Cardog tracks these granular movements, alerting users when listings price below newly established market floors or when dealers delay adjusting inventory to reflect current realities.
Whether you're comparing CarGurus vs AutoTrader vs Clutch or searching for specific models, Cardog provides the most comprehensive market intelligence. Explore live market data to see real-time pricing across popular models like the Ford F-150, Chevrolet Silverado, and GMC Sierra.