Edition 1/
The Ontario fleet, edition 1
The Ontario fleet
What the province actually drives: 8,223,713 passenger vehicles, read as a population from Ontario's own open vehicle files for 2024 and 2025.
- Kind
- Data edition
- Published
- Data as of
- Ontario vehicle population files as at 31 December 2024 and 2025
- Length
- 12 pages
Figures
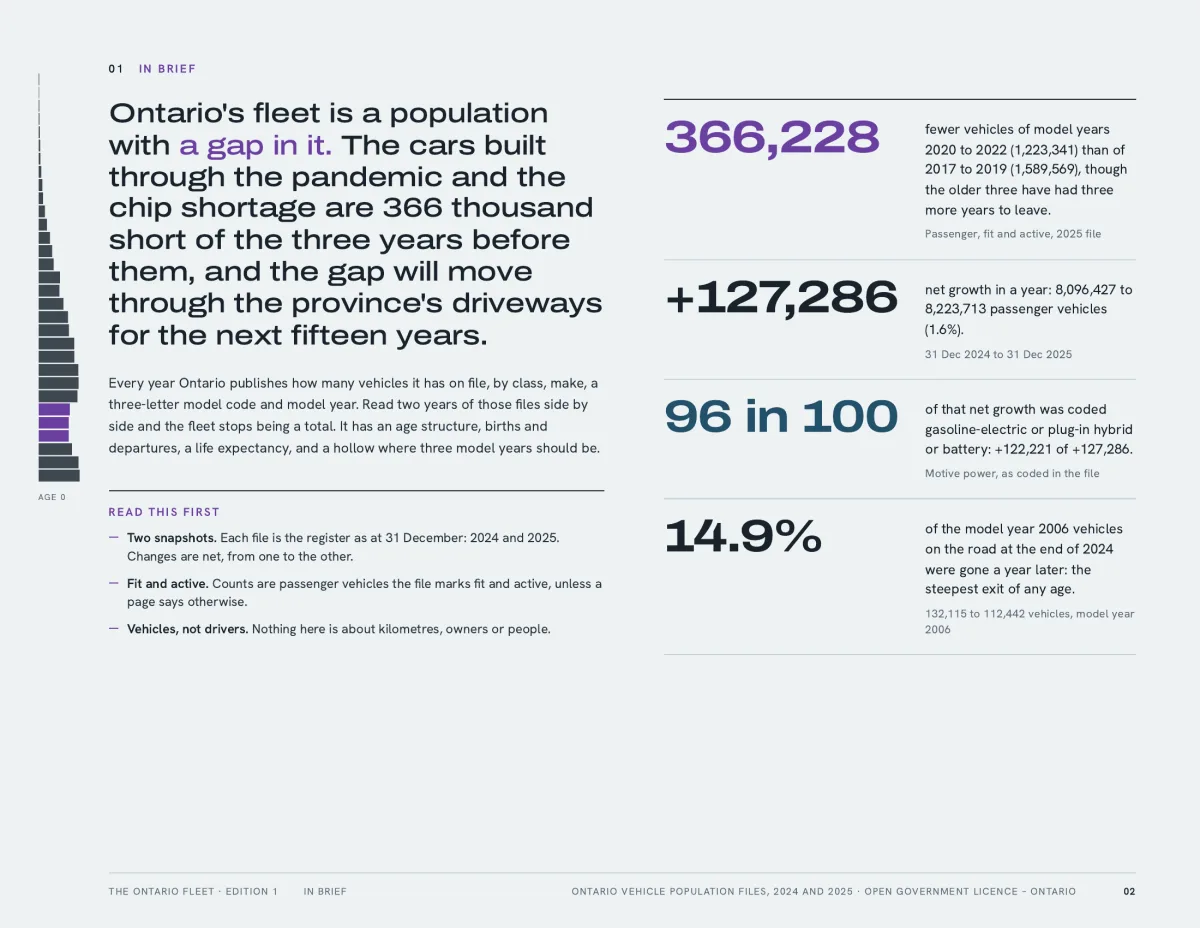
366,228
fewer vehicles of model years 2020 to 2022 (1,223,341) than of 2017 to 2019 (1,589,569), though the older three have had three more years to leave.
Passenger, fit and active, 2025 file. Ontario vehicle population, 2025
+127,286
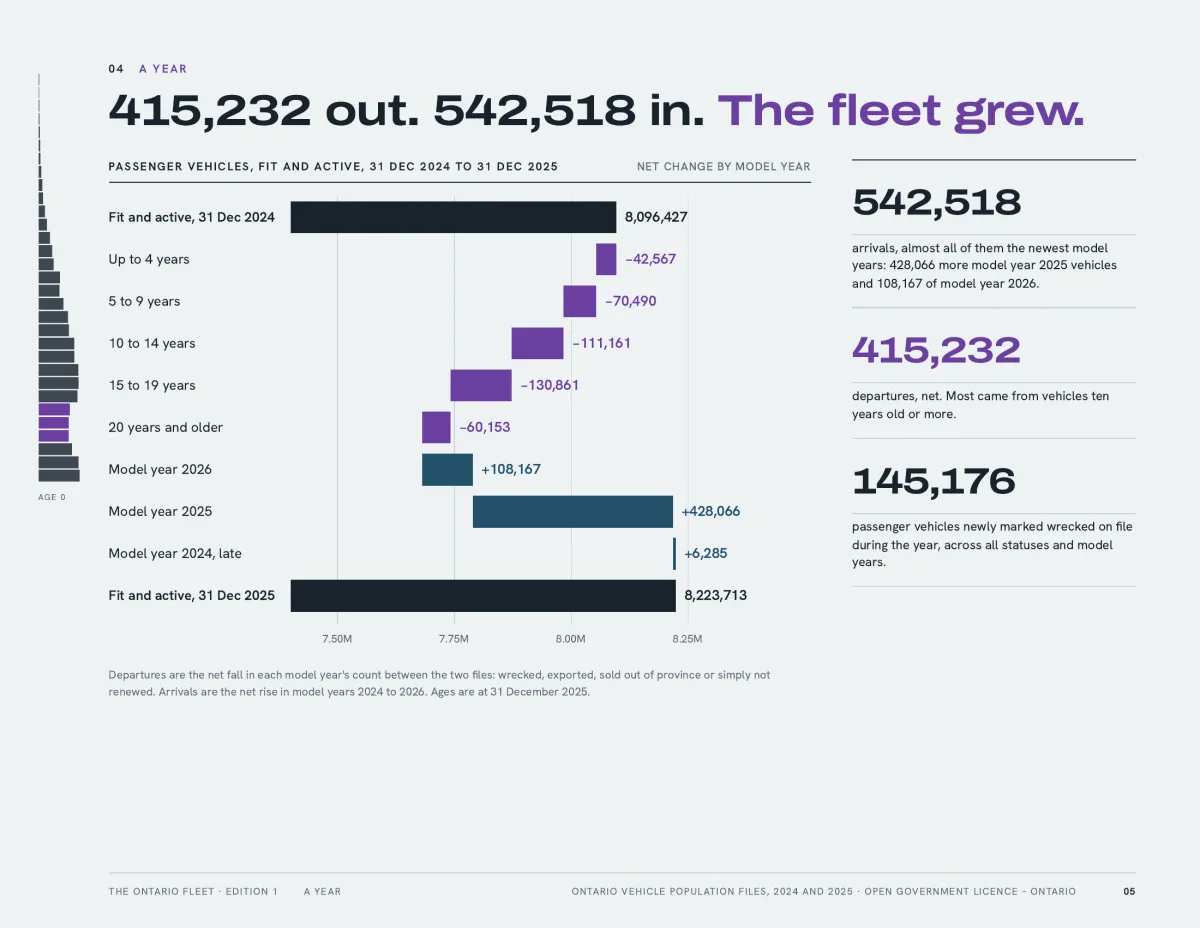
net growth in a year, 8,096,427 to 8,223,713 passenger vehicles (1.6%).
31 Dec 2024 to 31 Dec 2025. Ontario vehicle population, 2024 and 2025
96 in 100
of that net growth was coded gasoline-electric or plug-in hybrid or battery, +122,221 of +127,286.
Motive power, as coded in the file. Ontario vehicle population, 2024 and 2025
14.9%
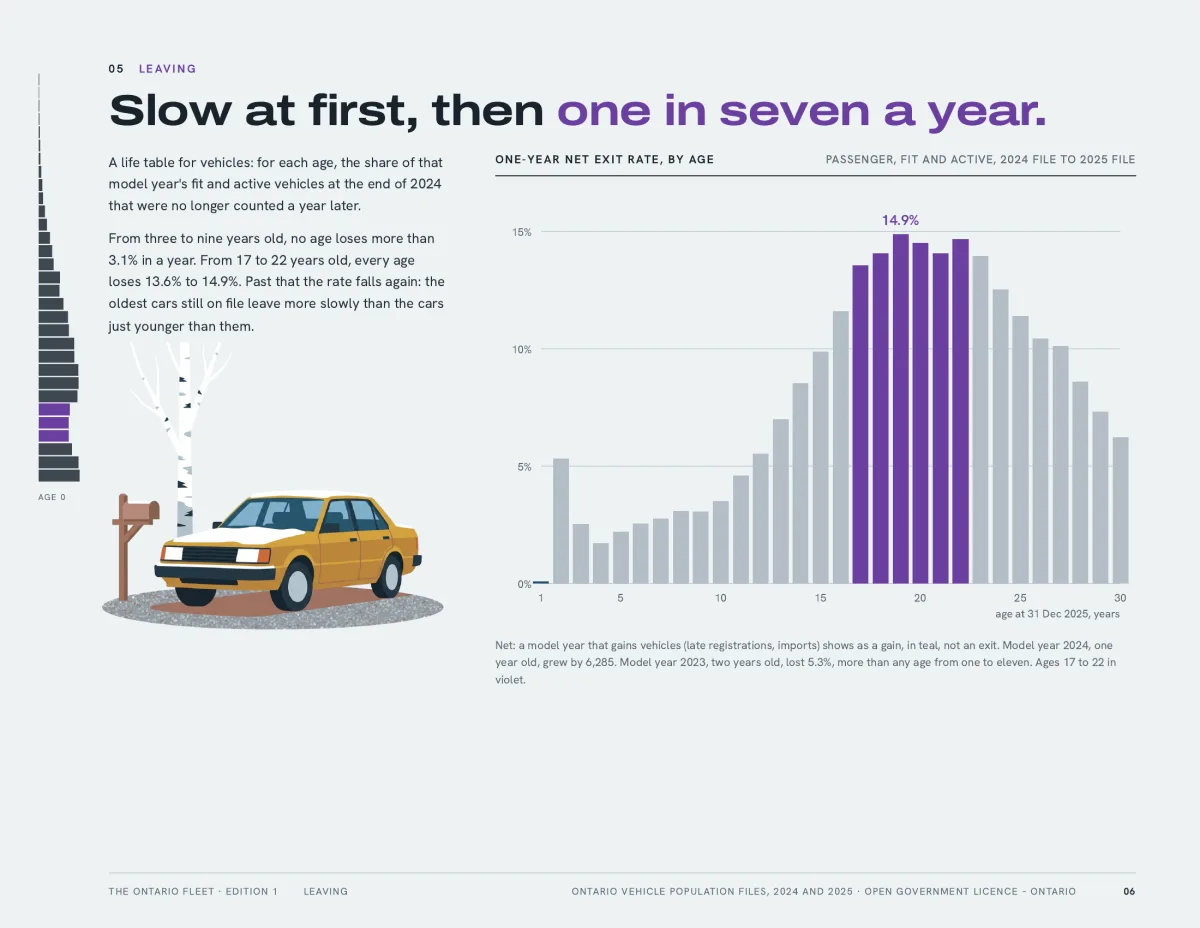
of the model year 2006 vehicles on the road at the end of 2024 were gone a year later, the steepest exit of any age.
132,115 to 112,442 vehicles, model year 2006. Ontario vehicle population, 2024 and 2025
The answer
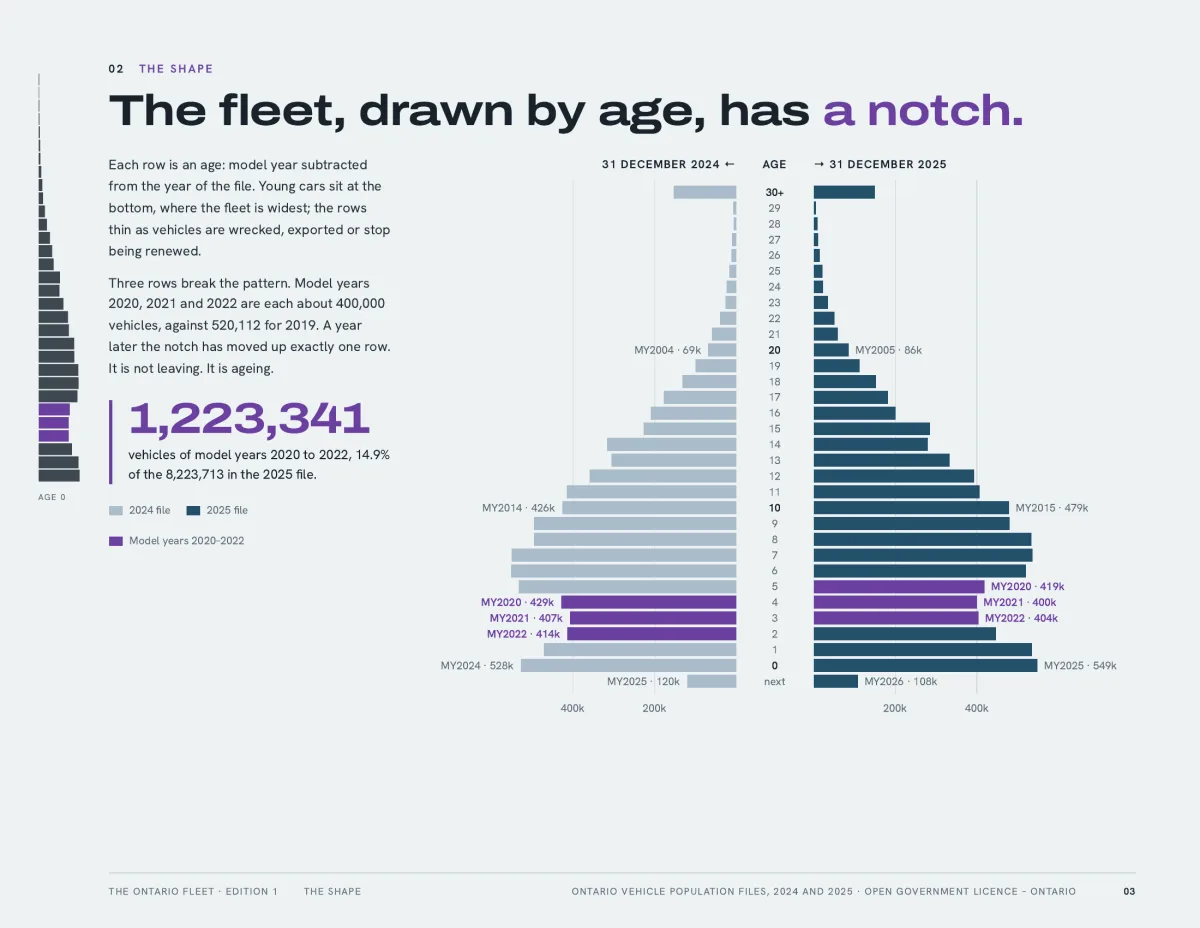
Ontario's fleet is a population with a gap in it. The 1,223,341 passenger vehicles of model years 2020 to 2022 in the 2025 file are 366,228 fewer than the 1,589,569 of model years 2017 to 2019, though the older three have had three more years to leave. Between the files as at 31 December 2024 and 2025 the fleet grew by a net 127,286 vehicles, from 8,096,427 to 8,223,713 (1.6%), and 122,221 of that growth was coded gasoline-electric, plug-in hybrid or battery. Gasoline is still 86.0% of the fleet.
Method
- The files. Ontario's vehicle population data, the yearly files as at 31 December 2024 and 31 December 2025, as published. Report A gives counts by class, make, model code, model year and status (85,029 and 86,990 rows); it reconciles to the class totals in both years.
- Fit and active. Unless a page says otherwise, a count is the file's fit and active status for the passenger class: 8,096,427 at the end of 2024, 8,223,713 at the end of 2025.
- Age. The year of the file less the model year. Next year's model year counts as age zero for the mean, and is shown as its own row in the pyramid.
- Flows. Arrivals and departures are net changes in each model year's count from one file to the next. A car that leaves and another that returns in the same model year cancel out.
- Motive power. The file's own codes, by letter. Plug-in hybrid and battery-only vehicles share one code and are not split.
- Models. Make codes follow the NCIC standard. Model codes have no published key; model names are Cardog's decoding, checked by a second pass that tried to prove each match wrong. They are ours, not the province's. The decode names 3,542,550 of 3,917,347 vehicles of model year 2018 or newer (90.4%); disputed and unnamed codes are left out, not guessed.
Every figure is computed from the published files by one script, with the reconciliations written as checks that stop the build if they fail.
Limits
- The files count vehicles on the register, not vehicles driven. A fit and active vehicle may sit in a garage all year.
- Changes between two snapshots are net. They do not follow any single vehicle.
- Model years are as recorded; a few vehicles carry a model year that does not match the build.
- Nothing here compares Ontario with another province.
- It counts vehicles, not kilometres, owners or people.
Sources
Data as of Ontario vehicle population files as at 31 December 2024 and 2025. Published October 28, 2026. Counts, shares, ages and model decodes computed by Cardog. The Government of Ontario does not endorse this report.
- Government of Ontario, vehicle population data, as at 31 December 2024 and 31 December 2025, data.ontario.ca. Contains information licensed under the Open Government Licence – Ontario.
This edition
- Supersedes
- None. This is the first edition.
- Superseded by
- Not yet. The same count, every December. Ontario publishes a new file each year, and each is read the same way, so a change in the fleet shows up as a change in the number, never in the method.
This edition is sealed: it is not edited after publication. A later one supersedes it, and this one stays readable here.
Questions
- How many passenger vehicles does Ontario have?
- 8,223,713 passenger vehicles were fit and active in the file as at 31 December 2025, up 127,286 (1.6%) from 8,096,427 a year earlier.
- What is the gap in the middle of the fleet?
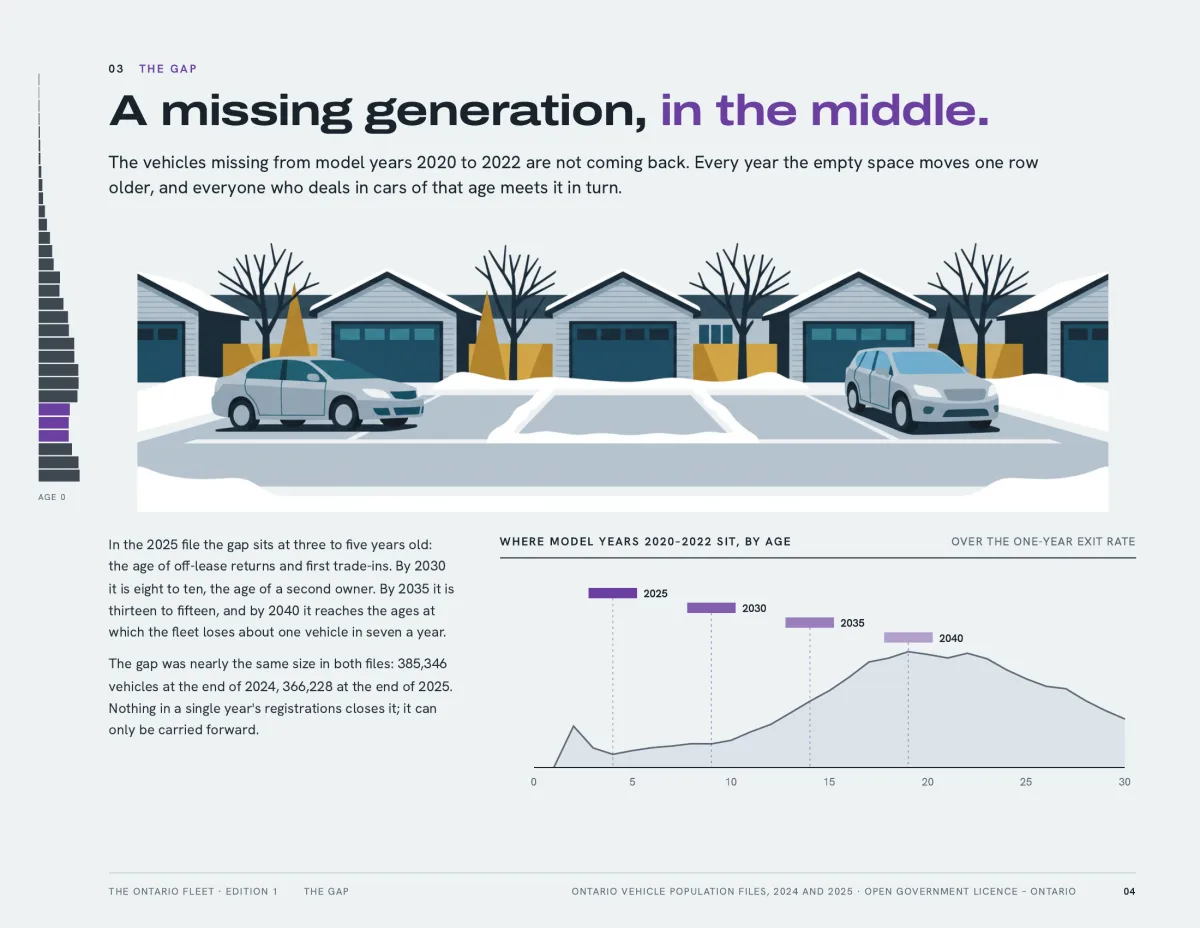
- Model years 2020, 2021 and 2022 hold 1,223,341 vehicles in the 2025 file, 366,228 fewer than model years 2017 to 2019. A year earlier the difference was 385,346. The gap moves one row older each year.
- Are the new vehicles electric?
- Of the net growth of 127,286 vehicles, 122,221 were coded gasoline-electric or plug-in hybrid or battery. Gasoline is still 86.0% of the fleet.